
Introduction
The escalating global concern over plastic waste and its environmental ramifications has prompted various sectors to reassess their reliance on single-use plastics. Scientific laboratories, which have traditionally depended on disposable plastic equipment for convenience and sterility, are no exception. Laboratories contribute significantly to plastic waste generation, with estimates suggesting that the scientific sector produces millions of tons of plastic waste annually. This reality underscores the urgent need for sustainable practices within research environments.
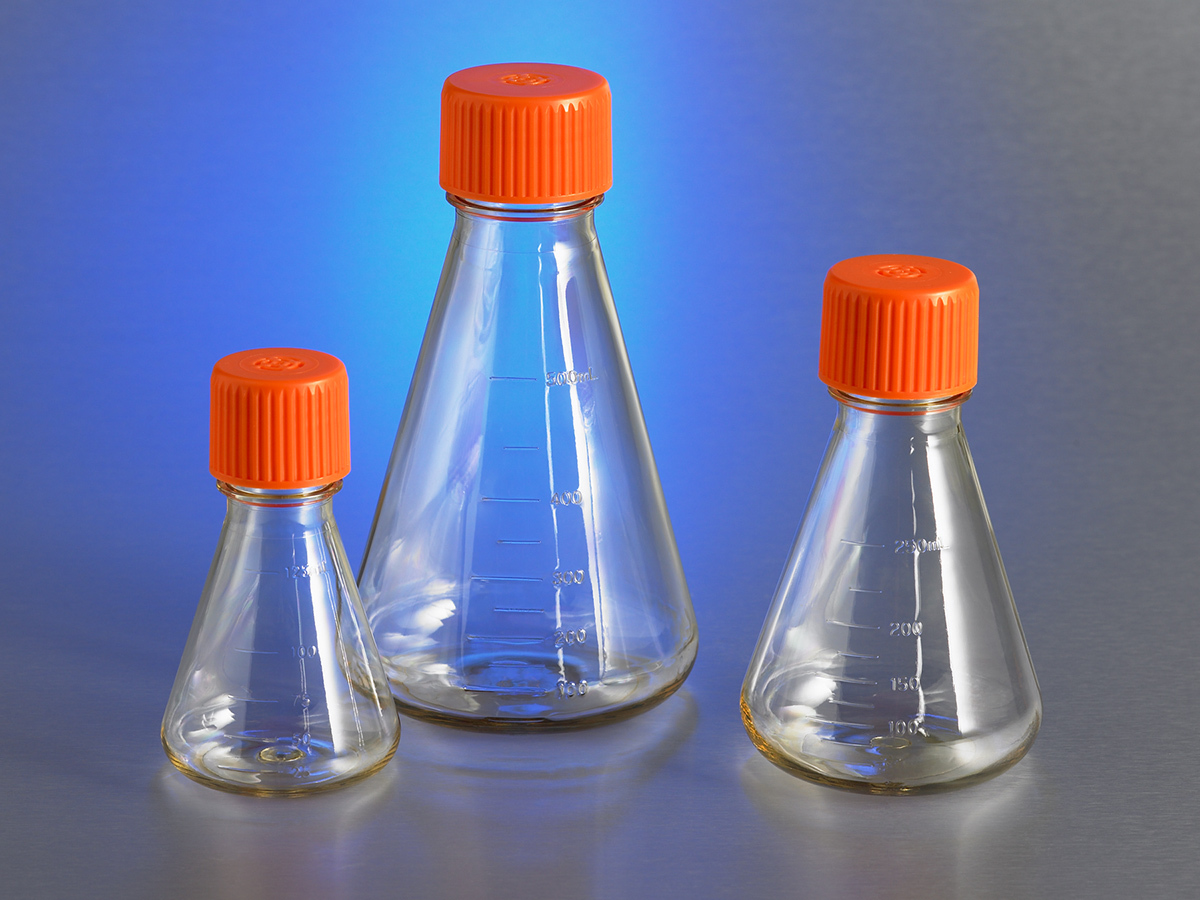
At EPFL, the SV-PTPSP core technological platform specializes in the production and purification of proteins in mammalian cells, operating within a Biosafety Level 1 (BSL1) environment. A critical component of their operations involves the use of single-use plastic flasks for cell culture experiments made from high-density polyethylene (HDPE) and polycarbonate (PC) materials. Annually, the platform purchases over 1200 disposable plastic flasks. While these flasks offer convenience and ensure sterility, their single-use nature raises significant environmental and economic concerns.
The environmental issues associated with the extensive use of disposable plastic flasks are multifaceted. Firstly, the production of plastic flasks involves the consumption of non-renewable resources such as petroleum and natural gas. The manufacturing process emits greenhouse gases (GHGs), contributing to global warming and climate change. Secondly, the disposal of plastic flasks after a single use adds to the growing problem of plastic pollution. Plastics can take hundreds of years to degrade, and improper disposal can lead to environmental contamination, affecting wildlife and ecosystems.
One potential solution is the adoption of reusable flasks that can be sterilized through autoclaving. Autoclaving involves using pressurized steam at high temperatures to sterilize equipment, effectively eliminating microorganisms. Reusable flasks made from durable materials, can withstand multiple autoclave cycles before they degrade. By transitioning to reusable flasks, the platform could significantly reduce plastic waste generation and lower long-term costs associated with purchasing disposable equipment.
It is important to note that reusable flasks have a limited lifespan before they degrade. As they undergo repeated autoclaving cycles, their structural integrity and performance can diminish. This degradation can lead to issues such as contamination risks or failure to maintain the required experimental conditions, ultimately affecting the reliability of results. For example, initial attempts at using glass flasks at the SV-PTPSP platform revealed a significant decline in performance after just a few autoclaving cycles, resulting in failed experiments. This highlights the importance of carefully evaluating both the material durability and the practicality of adopting reusable flasks in a research environment.
In addition to the challenges of flask durability, the environmental costs of autoclaving must also be considered to determine whether this approach represents a net improvement in sustainability. The autoclaving process consumes energy and water and may involve the use of detergents and other chemicals for cleaning. These inputs contribute to the overall environmental impact, potentially offsetting the benefits of reducing plastic waste.
These considerations underscore the importance of conducting a thorough Life Cycle Assessment to evaluate the environmental trade-offs between these two approaches. By assessing the complete life cycles of both single-use and reusable flasks, this study aims to provide data-driven insights to inform sustainable decision-making at the SV-PTPSP platform.
Objective of the study
In light of these considerations, this study aims to conduct a comprehensive Life Cycle Assessment (LCA) to evaluate the environmental impacts of autoclaving reusable flasks compared to the continued use of single-use plastic flasks at the SV-PTPSP platform. The assessment will consider the entire life cycle of the flasks, from the production of raw materials to end-of-life disposal, including the use phase involving autoclaving for reusable flasks.
Overview of similar studies
Some LCA study of the topic or related topics has already been performed. In fact, going over some of the findings helps us to understand the context of our current study and to specifically target questions that remain unanswered. To do so we have identified 4 studies (3 LCA’s and one aggregate study on 18 LCA’s) that have particular relevance for our own analysis. Namely, these studies focus on the laboratory environment and the life cycle of laboratory equipment.
Firstly, a 2022 LCA study of UCL’s Bartlett department by Y. Cai provides useful insights that help motivate our analysis. This study assessed the department’s overall emissions from 2018 to 2019, highlighting the main environmental contributors. While it grouped all lab procurements into a single category and did not focus solely on lab equipment, it showed that lab equipment and chemicals are major sources of greenhouse gas emissions, accounting for approximately 24% of the department’s total emissions [4]. This finding underscores the importance of examining laboratory-specific impacts, which our study aims to address more directly.
Furthermore, an LCA study commissioned by lab equipment manufacturer Eppendorf and one published as part of Volume 1 of the journal Advances in Sample Preparation examine environmental performance of plastic lab containers and of sample preparation techniques respectively. The Eppendorf study finds that raw materials, distribution and end of life (EoL) contribute the most to CO2 emissions outside of the lab. Within the lab, it highlights procurement and EoL management of containers as the biggest levers for improvement. The second study supports these findings, further indicating that while washing reusable containers increases the environmental burden (primarily due to chemical usage), this impact is outweighed by the environmental benefits gained through reuse [5], [6].
Finally, an aggregate study on a total of 18 cradle-to-gate LCA’s (5 additional LCA’s were used specifically for disposal methods) was published in the PLOS journal, analyzing the use of life cycle assessments to guide reduction in the carbon footprint of single-use lab consumables. This paper is particularly relevant to our study as it assesses equipment of the same material (HDPE) within a very similar context. The paper highlights polymer and raw material production as the largest contributors to overall emissions, followed by end-of-life when incineration was the chosen disposal method. Additionally, it concludes that the most significant emission reductions can be achieved through circular supply chains, and identifies disposal choice of the equipment as one of the main levers on impact within the lab [7].
Gaps addressed by this study
In light of these findings, this study aims to provide further insights into the trade-offs involved specifically in choosing between single-use and multi-use containers of different materials and sizes within the scope of SV-PTPSP’s research. It seeks to offer a comparative analysis of these trade-offs across the life cycle of each container type.
Additionally, this study is meant to take EPFL’s specific context into account, namely the regulations and processes that dictate work within the SV-PTPSP lab. This means considering the local energy mix, the geographical context as well as the specific equipment and washing infrastructure available to the staff.
Project goals
As mentioned, this study specifically addresses the SV-PTPSP lab at EPFL and was commissioned by the lab as part of a broader EPFL initiative to evaluate the environmental impact across its labs and departments. The study aims to optimize the lab’s sustainability performance by assessing and comparing the environmental impacts of single-use versus multi-use containers and flasks in lab operations.
The results of this study are intended to inform procurement and usage decisions regarding containers, helping to minimize environmental impact at the SV-PTPSP lab and, more generally, at EPFL. This information could guide the lab’s sustainability practices, potentially influencing resource efficiency and waste reduction.
The primary audience for this study is decision-makers within EPFL, including lab managers and sustainability officers. However, it may also benefit other laboratories working under similar conditions, both in terms of scientific focus and geographic context.
As such, if the study finds significant differences between the two approaches (reuse vs. single-use), these findings may be used for comparative assertions disclosed to the public.
Function and functional unit
The primary function of the product systems under consideration is to provide sterile flask volume for the production and purification of proteins in mammalian cell cultures at the SV-PTPSP core technological platform of EPFL, Lausanne, in 2024. The flasks are critical to ensuring the sterility and efficiency of cell culture experiments conducted in a Biosafety Level 1 (BSL1) environment.
The product systems being compared are:
Single-use flasks
Multi-use flasks
While both systems serve the same primary function, their environmental impacts differ due to the single-use nature of plastic flasks versus the energy-intensive maintenance of reusable flasks. To ensure meaningful comparison, functional equivalence between the systems has been established by considering scalability and interchangeability across flask sizes and materials.
Functional Unit
The functional unit for this study is defined as:
The use of flasks sufficient to process 25 L of a certain cell culture medium at EPFL SV-PTPSP in 2024.
This definition assumes that flasks of the same material are scalable and interchangeable for the experimental process. For example, the same culture volume could be achieved using one 4 L flask or two 2 L flasks. This allows for a direct comparison of systems while accounting for variations in flask size and usage frequency.
Key Assumptions:
Scalability: Flasks of different volumes made from the same material can perform equivalent functions by scaling their usage appropriately.
Interchangeability: Experiments requiring a specific flask type can use alternative volumes without compromising functionality.
Material Grouping: Flasks of the same material are grouped for analysis to simplify comparisons across different product systems.
Limitations
The functional equivalence assumes that all flask sizes of the same material are equally suited to the cell culture process. Any material- or size-specific performance issues, such as sterility or structural integrity, are not explicitly considered in this functional unit but will be addressed in the broader LCA discussion.
Description of the product systems
This LCA study evaluates the environmental impacts of using single-use plastic flasks versus reusable flasks with autoclaving for protein production in a BSL1 lab setting at EPFL PTPSP. The functional unit (FU) for this analysis is defined as the "use of flasks sufficient to process 25 liters of cell culture medium in 2024." The process tree and system boundaries for each product system are designed to capture all relevant life cycle stages, from raw material extraction to end-of-life treatment.

Process Tree Overview
The process tree, as shown in Figure 4, includes two main product systems:
Single-Use Plastic Flasks: These flasks are manufactured from high-density polyethylene (HDPE) and polycarbonate (PC) materials or polypropylene (PP). They go through production stages including material extraction, molding, and assembly. Once used in the lab, these flasks are disposed of by incineration with energy recovery.
Reusable Flasks with Autoclaving: These flasks are sterilized and reused multiple times through autoclaving. This system includes additional processes like washing and autoclaving, which require inputs of electricity, tap water, and deionized water. At the end of their lifecycle, the reusable flasks are also disposed of through incineration with energy recovery.
System Boundaries and Process Classification
Foreground Processes (Gate-to-Gate)
These processes occur within the lab’s operational boundaries and include flask usage, washing, and autoclaving. The impacts of these stages, such as energy and water consumption, are directly controlled by the lab and are thus categorized as gate-to-gate processes.
Background Processes (Cradle-to-Gate)
Background processes include the upstream activities of raw material extraction and flask production. These cradle-to-gate stages are outside the lab’s direct control but are essential to the product systems being assessed. Examples include HDPE and PC production, molding, transport, and end-of-life processing.
The system boundary is set as cradle-to-grave to capture the entire lifecycle of both single-use and reusable flasks, ensuring a comprehensive assessment.
Inclusions and Exclusions
In the life cycle assessment of single-use and multi-use flasks, certain processes and resources are included or excluded to focus on the most impactful stages. Included are the production of flask components (cap and body), plastic packaging bags, and box materials. Plastic bags are used frequently to maintain sterility after each cleaning of reusable flasks, adding significantly to the environmental impact. The box material also contributes to the lifecycle footprint, especially during transportation. Additionally, the resources used for washing and autoclaving reusable flasks, such as water and electricity, are included due to their high consumption across multiple use cycles. Conversely, excluded processes include resources for initial flask assembly, as their impact is minimal compared to other stages, and on-campus maintenance and transportation, which are negligible. Furthermore, the energy and resources involved in manufacturing and maintaining the autoclaving and washing machines are excluded due to lack of specific data and the shared usage of these machines across various lab functions. These inclusions and exclusions ensure that the assessment focuses on the primary environmental impacts associated with each flask system.
End-of-Life (EoL) Treatment
For the end-of-life (EoL) treatment of flasks, incineration with energy recovery is utilized, allowing the energy generated from burning the flask materials to offset some of the system’s energy demands. This is treated by introducing an end of life recycling: considering both waste disposal and the environmental credit from recovered energy. Rather than feeding energy directly back into the system, the recovered energy offsets the overall energy requirements, slightly reducing the environmental burden associated with energy use. This boundary expansion enables the LCA to capture the dual function of incineration, accurately reflecting the impact of energy recovery at the EoL stage.
Reference flows and key parameters
For this analysis, the Corning 431144 flask (250 mL) was selected, which would require 100 experiments of 250 mL each per FU to process the total volume.
Single-Use Flask Requirement (\(\text{RF}_{\text{single}}\))
\[\text{RF}_{\text{single}} = \frac{100 \ \text{experiments/FU}}{1 \ \text{experiment/flask}} = 100 \ \text{flasks/FU}\]
Thus, for the single-use scenario, 100 flasks are required per FU.
Multiple-Use Flask Requirement (\(\text{RF}_{\text{multi}}\))
\[\text{RF}_{\text{multi}} = \frac{100 \ \text{experiments/FU}}{10 \ \text{experiments/flask}} = 10 \ \text{flasks/FU}\]
For the multiple-use scenario, only 10 flasks are required per FU. Empirical data from PTPSP lab suggests each flask can be reused for up to 10 experiments.
After defining the function unit, process tree and system boundaries, with data acquired in Section 6, the key parameters about flask use and washing facility are calculated and shown in Table 1 and Table 2 respectively, the calculation processes are listed in Appendix.
| Unit Process | Unit | Key parameters |
|---|---|---|
| PP for Cap Production | g/FU | - 830 g per FU for single-use scenario (100 caps per FU) - 83 g per FU for multiple-use scenario (10 caps per FU) - Material: Polypropylene (PP) |
| PC for Body Production | g/FU | - 4900 g per FU for single-use scenario (100 bodies per FU) - 490 g per FU for multiple-use scenario (10 bodies per FU) - Material: Polycarbonate (PC) |
| Electricity for Bag Sealing | kWh/FU | - 2.5 kWh per FU for single-use scenario (100 items) - 0.25 kWh per FU for multiple-use scenario (10 items) - Sealing energy requirement |
| Box Production | kg/FU | - 2.478 kg of cardboard per FU for single-use scenario (2 boxes for 100 flasks) - 0.2478 kg of cardboard per FU for multiple-use scenario (1/5 of a box for 10 flasks) |
| Bag Production (Paper) | g/FU | - 74.35 g per FU for single-use scenario (100 bags) - 74.35 g per FU for multiple-use scenario (10 bags) - Material: Paper (50% of bag composition) |
| Bag Production (HDPE) | g/FU | - 74.35 g per FU for single-use scenario (100 bags) - 74.35 g per FU for multiple-use scenario (10 bags) - Material: High-Density Polyethylene (HDPE, 50% of bag) |
| Distribution | tkm/FU | - 161.43 tkm per FU for single-use scenario (weight: 8.3567 kg per FU) - 44.58 tkm per FU for multiple-use scenario (weight: 2.3075 kg per FU) - Transportation path: 80% by sea/truck (China to Lausanne via Le Havre), 20% by air/truck, final disposal 11.5 km to incineration plant |
| Unit Process | Unit | Key parameters |
|---|---|---|
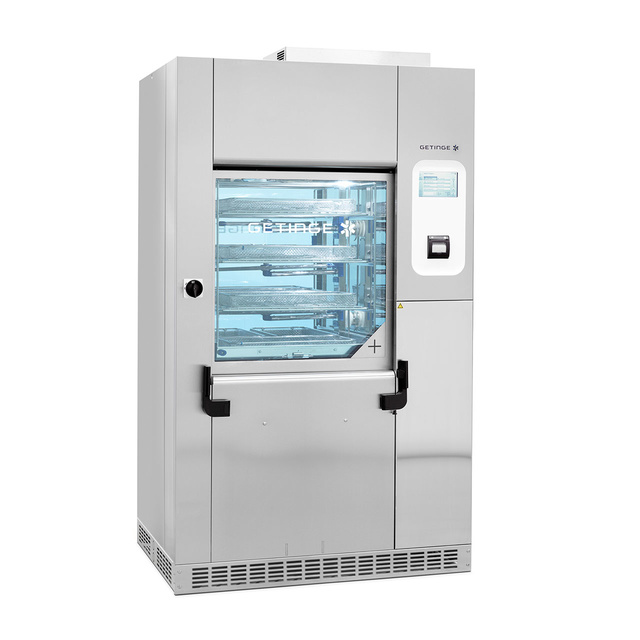
| Electricity for Washing | kWh/FU | - 0.9375 kWh per FU (PTPSP allocation) - Washer model: Getinge S8666-7 - 32 flasks per cycle, 0.3125 cycles per FU - Total electricity: 3.125 kWh per FU |
| Tap Water for Washing | L/FU | - 9.375 L per FU (PTPSP allocation) - 31.25 L per FU total - 32 flasks per cycle, 0.3125 cycles per FU |
| Deionized Water for Washing | L/FU | - 2.8125 L per FU (PTPSP allocation) - 9.375 L per FU total - 32 flasks per cycle, 0.3125 cycles per FU |
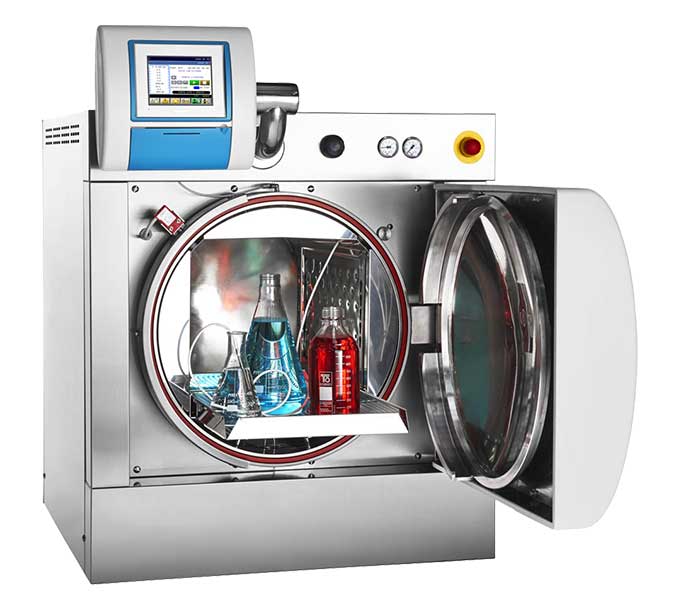
| Electricity for Autoclaving | kWh/FU | - 0.4285 kWh per FU (PTPSP allocation) - Autoclave model: FOB3 TS - 28 flasks per cycle, 0.3571 cycles per FU - Total electricity: 1.4284 kWh per FU |
| Tap Water for Autoclaving | L/FU | - 6.9642 L per FU (PTPSP allocation) - 23.214 L per FU total - 28 flasks per cycle, 0.3571 cycles per FU |
| Deionized Water for Autoclaving | L/FU | - 3.2139 L per FU (PTPSP allocation) - 10.713 L per FU total - 28 flasks per cycle, 0.3571 cycles per FU |
| Washer Utilization per FU | cycles/FU | - 0.09375 cycles per FU - Contributes approximately 0.00625% of the washer’s service life per FU |
| Autoclave Utilization per FU | cycles/FU | - 0.1071 cycles per FU - Contributes approximately 0.00714% of the autoclave’s service life per FU |
Data sources and assumptions
Flask data
This study examines the performances of different flasks when used one or multiple times. The flasks presented below are produced in China, with the exception of the TPP model, that is sourced from Switzerland directly. For given types of flasks, data on unit price, number of annual purchase, number of cleaning before disposal, maximum number of flasks per cleaning cycle in washer’s chamber and autoclaving machine’s chamber is provided by PTPSP’s statistics, shown in Table 3.
| Type | Unit Price/CHF | Annual purchase | Nb cleaning | Nb/Washer | Nb/Autoclave |
|---|---|---|---|---|---|
| Nest 786111 | 78.3 | 30 | 5\(\sim\)8 | 4 | 6 |
| Nest 785111 | 59.8 | 6 | 5\(\sim\)8 | 16 | 11 |
| Thompson 931116 | 125 | 45 | 0 | 4 | 6 |
| Thompson 931114 | 48.3 | 20 | 0 | 12 | 6 |
| Thompson 931113 | 57.6 | 25 | 0 | 16 | 16 |
| Corning 430421 | 6.7 | 69 | 10 | 64 | 45 |
| Corning 431144 | 8.32 | 60 | 10 | 32 | 28 |
| Corning 431145 | 7.72 | 30 | 10 | 18 | 18 |
| Corning 431147 | 17.25 | 100 | 10 | 18 | 18 |
| TPP 87600 | 12.5 | 468 | 1 | 64 | >100 |
Parameters of the flasks used in the lab are shown in Table 4. The volume in the table corresponds to the nominal volume of each type of flask, raw materials used for manufacturing the body and cap are from the websites of producers[1], [8], [9], [10]. Data on mass, height and diameter is measured by group members in the lab.
| Type | Volume | Body material | \(m_\text{body}\)/g | Cap material | \(m_\text{cap}\)/g | Height/cm | \(\Phi\)/cm |
|---|---|---|---|---|---|---|---|
| Nest 786111 | 3 L | PC | 237.1 | HDPE | 19 | 24 | 17 |
| Nest 787011 | 5 L | PC | 367.1 | HDPE | 28.9 | 28 | 22 |
| Nest 785111 | 2 L | PC | 203.7 | HDPE | 19 | 20 | 15 |
| Thompson 931116 | 5 L | PC | TBM | PTFE | TBM | N/A | N/A |
| Thompson 931114 | 2.8 L | PC | TBM | PTFE | TBM | N/A | N/A |
| Thompson 931113 | 1.6 L | PC | TBM | PTFE | TBM | N/A | N/A |
| Corning 430421 | 125 mL | PC | 26.5 | PP | 7.7 | 12 | 7 |
| Corning 431144 | 250 mL | PC | 49 | PP | 8.3 | 14 | 9 |
| Corning 431145 | 500 mL | PC | 66 | PP | 9 | 16 | 11 |
| Corning 431147 | 1000 mL | PC | 113.1 | PP | 10.5 | 19 | 13 |
| TPP 87600 | 600 mL | PP | 98.5 | PE | 12.2 | 17 | 9 |
Washing facility data
Data in Table 5 shows key statistics on the washer and autoclaving machine from the washing facility on EPFL campus, including average electricity usage, tap water usage, demineralized water usage and expected service life of the two machines. The total weight and effective chamber volume of them can be found in the manufacturers’ website [2], [3].
| Model | Washer Getinge S8666-7 | Autoclave (sterilizer) FOB3 TS |
|---|---|---|
| Average electricity use (kWh/cycle) | 10 | 4 |
| Average tap water use (L/cycle) | 100 | 65 |
| Average demineralized water use (L/cycle) | 30 | 30 |
| Average service life (years) | 20 | 20 |
| Effective chamber volume (L) | 316 | 36 |
From the similar LCA study on the autoclaving machine [11], the raw materials used for manufacturing the washer Getinge S8666-7 and the sterilizer FOB3-TS are estimated by down-scaling and shown in Table 6 .
| S/n | Material types | Washer: Mass (kg) | Sterilizer: Mass (kg) |
|---|---|---|---|
| 1 | Stainless Steel 316 | 246.9 | 132.6 |
| 2 | Stainless Steel 304 | 70.6 | 37.9 |
| 3 | Aluminum | 3.3 | 1.8 |
| 4 | Glass Wool | 3.9 | 2.1 |
| 5 | PTFE | 9.7 | 5.2 |
| 6 | Copper | 0.7 | 0.4 |
| 7 | Cast Iron | 11.1 | 6.0 |
| 8 | Electronic and control | 3.9 | 2.1 |
| Total weight | 350 | 188 |
Assumptions
Bag sealing and packaging
Bag: 50 % paper and 50 % HDPE. Since each flask is re-bagged after each sterilization, need 100 bags per FU. Assuming each re-bag is constructed from the same materials as the original packaging and transported from China to the lab in Switzerland.
Electricity for Bag Sealing: 0.025 kWh per item, estimated based on typical energy requirements for heat sealing [12].
Flask Dimensions for Packaging: 15 cm height and 10 cm diameter — Packaging size is adjusted to fit the flask dimensions and allow for sealing.
Cardboard Box for 50 Flasks: 1.239 kg, estimated based on typical corrugated box size and density.
Packaging Material Density: 700 kg/cm3, typical corrugated box density.
Transportation Path (Flask)
80% by Sea and Truck: About 80 % of deliveries to Switzerland are shipped by sea from the manufacturing site in China to Le Havre, France. From there, the flasks are transported by truck to Geneva, then to Lausanne ( 61 km from Geneva). This route covers approximately 21588.21 km by sea and 742.93 km by truck. Sea freight is chosen for cost-effectiveness and its lower carbon footprint compared to air freight.
20% by Air and Truck: To ensure flexibility and meet urgent demand, around 20 % of shipments are sent by air directly from China to Geneva, covering 7098.78 km by air, then trucked 61 km to Lausanne. Air freight is faster but has a higher environmental impact.
Disposal: After use, flasks are incinerated, with an average transportation distance of 11.5 km from EPFL to the nearest incineration facility.
Cleaning
Neglecting Detergent Usage: Detergent used in the washing process is ignored for this assessment.
Operation frequency: Assume that each machine (washer and autoclave) completes 200 cycles per year (baseline scenario) throughout its 20-year service life.
Machine fill factor: Since the chamber cannot be fully optimized due to flask arrangement (flasks placed upside down on nozzles), the effective capacity differs between washing and sterilization processes. In baseline scenario, machine fill factor is estimated as 50%.
Background processes
The background (cradle-to-grave) unit processes included in this project are shown in Table 7, which comes from Ecoinvent databases [13].
| Input | Provider |
|---|---|
| Electricity | market for electricity, low voltage \(|\) electricity, low voltage \(|\) cutoff, S - CH |
| Raw HDPE | market for polycarbonate \(|\) polycarbonate \(|\) cutoff, S - GLO |
| Moulding HDPE / PC | market for injection moulding \(|\) injection moulding \(|\) cutoff, S - GLO |
| Raw PC | market for polyethylene\(|\) polyethylene, high density, granulate \(|\) cutoff, S - GLO |
| Corrugated Box | market for corrugated board box \(|\) corrugated board box \(|\) cutoff, S - RoW |
| Tap Water | market for tap water \(|\) tap water \(|\) cutoff, S - CH |
| Deionized Water | market for water, deionized \(|\) water, deionized \(|\) cutoff, S - CH |
| Cast Iron | cast iron production \(|\) cast iron \(|\) Cutoff, S |
| Electronic and control | electronics production, for control units \(|\) electronics, for control units \(|\) Cutoff, S |
| Glass Wool | glass wool mat production \(|\) glass wool mat \(|\) Cutoff, S |
| Aluminum | market for sheet rolling, aluminium \(|\) sheet rolling, aluminium \(|\) Cutoff, S |
| Copper | market for sheet rolling, copper \(|\) sheet rolling, copper \(|\) Cutoff, S |
| Stainless Steel 304 | market for steel, chromium steel 18/8 \(|\) steel, chromium steel 18/8 \(|\) Cutoff, S |
| PTFE | market for tetrafluoroethylene \(|\) tetrafluoroethylene \(|\) Cutoff, S |
| Waste Water | market for wastewater, average \(|\) wastewater, average \(|\) Cutoff, S - CH |
Impact assessment
The eight evaluated scenarios and their labels are:
Single use of a Corning 43144 flask (label S-44, base scenario)
Multiple use of a Corning 431144 flask (label M-44)
Single use of a Corning 431145 flask (label S-45)
Multiple use of a Corning 431145 flask (label M-45)
Single use of a Nest 785111 flask (label S-N11)
Multiple use of a Nest 785111 flask (label M-N11)
Single use of a TPP 87600 flask (label S-T00)
Multiple use of a TPP 87600 flask (label M-T00)
The aggregated damage level impact categories are evaluated using the IMPACT World+ footprint framework. The results of the impact assessment are presented in Table 8 and Table 9. In order to be able to compare the scenarios between one another, an internal normalization for each category has been performed, and the results are graphically displayed in Figure 5. Additionally, the midpoint impact categories for Environmental quality and Human health are also presented in Figure 9 and Figure 11 .
| Impact category | S-44 | M-44 | S-45 | M-45 | Unit |
|---|---|---|---|---|---|
| Carbon footprint | 69.30 | 27.00 | 44.17 | 20.80 | [kg CO\(_2\) eq.] |
| Fossil and nuclear energy use | 906.81 | 639.55 | 570.98 | 512.14 | [MJ deprived] |
| Remaining Ecosystem quality damage | 6.71 | 4.18 | 3.76 | 3.23 | [PDF m\(^2\) yr] |
| Remaining Human health damage | 5.36E-05 | 3.06E-05 | 3.35E-05 | 2.41E-05 | [DALY] |
| Water scarcity footprint | 19.53 | 52.12 | 12.56 | 43.34 | [m\(^3\) world eq.] |
| S-N11 | M-N11 | S-T00 | M-T00 | Unit | |
|---|---|---|---|---|---|
| Carbon footprint | 36.11 | 15.9 | 27.1 | 15.36 | [kg CO\(_2\) eq.] |
| Fossil and nuclear energy use | 463.67 | 314.94 | 559.25 | 331.71 | [MJ deprived] |
| Remaining Ecosystem quality damage | 4.25 | 2.31 | 2.74 | 1.7 | [PDF m\(^2\) yr] |
| Remaining Human health damage | 2.87E-05 | 1.70E-05 | 1.61E-05 | 1.02E-05 | [DALY] |
| Water scarcity footprint | 10.27 | 22.62 | 10.46 | 9.86 | [m\(^3\) world eq.] |

For the different scenarios encountered in this work, the main processes can be divided into 5 categories:
Autoclaving process
End of Life
Assembly and production of the flask
Transport
Washing
In this section, the results for all the aggregated damage level impact categories are detailed with the contribution of each process and compared with one another.
Carbon footprint
The contribution for each process category are displayed in Figure 6.

As expected, reusing the flasks generates a lower carbon footprint. However, using the Corning 431144 flasks multiple times is roughly equivalent to a single use of the TPP 87600 flask type overall (27.0 against 27.1 [kg CO\(_2\) eq.]). Among all scenarios, the carbon footprint of transport is minimal, ranging from 0.5 \(\%\) (Multiple, Corning 431145) to 5.3 \(\%\) (Single, Nest 78511) of the total impact, and is therefore not seen as an effective parameter for potential of improvement.
Another point of notice is the EoL impact for the TPP 87600. The impact is lower than the Corning 431144 but higher compared to other flasks. Furthermore, the EoL represents 38.7 \(\%\) of its total carbon footprint, the highest fraction among all flasks. Looking at the properties of the different flasks, we can see that this is related to the material density of the TPP 87600 (see Table 10). Because it has a higher material density than Corning 431145 and Nest 785111, there will be more material to incinerate for the same volume based on the functional unit.
Also note that because the body material of the TPP flask differs from that of the others (PE instead of PC), its footprint for production and assembly is lower, making it overall better for single use for this damage category. For instance for the Single use Nest 785111 the total results for the "market for polycarbonate polycarbonate Cutoff, S" in the body production amount to 20.88 [kg CO\(_2\) eq.], while for the TPP 87600 the "market for polypropylene, granulate polypropylene, granulate Cutoff, S" process in the body production is 9.38 [kg CO\(_2\) eq.], less than half of the production impact.
| Flask | Total mass [g] | Volume [L] | Density [g/L] |
|---|---|---|---|
| Flask | Total mass [g] | Volume [L] | Density [g/L] |
| Corning 431144 | 57.3 | 0.25 | 229.2 |
| Corning 431145 | 75 | 0.5 | 150 |
| Nest 785111 | 222.7 | 2 | 111.35 |
| TPP 87600 | 110.7 | 0.6 | 184.5 |
Fossil and nuclear energy use
The contribution for each process category are displayed in Figure 7.

Upon examination of the results, one can see that the TPP 87600 flask has a surprisingly large impact due to the production and assembly steps. The multiple use case is especially important in this impact category relatively to its role in the other categories. Similarly to its carbon footprint, this is due to the difference in material. For single use, the TPP 87600 has an impact of 337 [MJ deprived], in contrast to the 283.3 of the Nest 78111 flask ( "market for polypropylene, granulate polypropylene, granulate Cutoff, S" and "market for polycarbonate polycarbonate Cutoff, S" processes). This impact catergory is also the only one for which both TPP use cases rank second worse among all options. In fact, multiple use of Corning 431145 and Nest 785111 is better than single use of TPP, with Nest 785111 being the least energy intensive overall.
Despite this, the Single-use TPP 87600 flask still outperforms the multiple use of the Corning 431144 flask. This is because the washing and autoclaving processes require energy outweighing that required for the production of the TPP87600 flask. The impact of changing the energy source, away from fossil and nuclear, will be investigated in the sensitivity analysis section.
Remaining Ecosystem quality damage
The contribution for each process category are displayed in Figure 8.


Unlike the other impact categories, transport plays a significant role for the remaining ecosystem quality damages. Notably, it represents 13% of the impact contribution of the Corning 431144 flask (single-use), and even 16% of that of the Nest 785111 (single-use). Note that the Swiss-sourced TPP flask is not significantly affected by transport related impacts. Also note that the effect of transport is distributed over each use when using the flask multiple times and is thus negligible for the multiple-use cases of all flasks.
Again, as expected, washing and autoclaving are almost the sole contributors to the impact related to the multiple-use scenarios (except for TPP that is reused only once). This is due to the pollution of the water during the cleaning stages, which is showcased by the relative importance of freshwater ecotoxicity for the multiple-use scenario as described in Figure 9 (roughly 30% of damage contribution for multiple-use, except TPP which is reused only once).
Remaining Human health damage
The contribution for each process category are displayed in Figure 10. Furthermore, the relative midpoint impact categories for human health are shown in Figure 11.
Figure 11 shows that a lot of the impact on human health for the multiple use of the flasks comes from the water availability, which is in the 30 to 50 \(\%\) range, depending on the flask. Similarly, for the single use cases, the long term climate change impact plays a significant role, representing almost 50 \(\%\) of the impact.
Similarly to other damage categories (e.g fossil and nuclear energy use), we see that using of the Corning 431144 flask multiple times is only significantly better when compared to the Single use of the same flask. It slightly improves compared to the single use of the Corning 431145, but both single and multiple use of the other flasks outperform it with respect to this indicator.


Water scarcity footprint
The contribution for each process category are displayed in Figure 12 .

As it could be expected the impact on water scarsity is higher for the product systems that require Autoclaving and washing (e.g. multiple use). In particular, with respect of this damage category, the multiple use of the Corning 431144 and 431145 should be avoided as it impacts are more than twofold compared to the worst-performing single use flask. However, the multiple use of the Nest 78511 is comparable with the single use of the Corning 431144 flask, so it is a viable option, if one considers the other damage impact categories.
Finally, and more interestingly, the multiple use of the TPP 87600 has an impact comparable,and slightly lower, than all the single-use flasks. This goes to show that the improvement (reduction in Assembly and EoL impacts) due to the reusing of the flask is compensated by the increased use of water that is a consequence of the washing and Autoclaving processes. A potential improvement to minimize use of water could be to improve the fill factor of the machine. This path will be explored in the sensitivity analysis.
Sensitivity Analysis
Analysis of Key Input Parameters
The sensitivity analysis was conducted to determine how changes in key input parameters influence the environmental performance of the Corning Flask 431144 during its use phase. The analysis specifically evaluated the sensitivity of five key environmental indicators: Carbon Footprint, Fossil and Nuclear Energy Use, Remaining Ecosystem Quality Damage, Remaining Human Health Damage, and Water Scarcity Footprint.
To achieve this, a 10% increase was applied independently to each global parameter, while keeping all other inputs constant. This systematic approach allowed us to identify which parameters contribute most significantly to the environmental impacts and highlight potential hotspots for performance improvement.
Among the parameters tested, three parameters emerged as the most significant influencers of the results: Machine Annual Cycle (+10%), Mass Body Corning (+10%), and MFF (Ratio of filled machine) (+10%). The results of these changes are summarized in Figure 13, which compares the percentage changes across all five indicators.

Key Findings
The MFF parameter (+10%) had the largest influence on multiple indicators, showcasing its critical role in energy consumption and resource impacts. Specifically, it resulted in a \(-8.46\%\) reduction in Water Scarcity Footprint, followed by \(-7.35\%\) in Fossil and Nuclear Energy Use, and \(-7.19\%\) in Remaining Human Health Damage. This significant reduction indicates that the energy-related parameters, particularly those associated with machine energy consumption during washing or autoclaving, dominate the environmental performance in the use phase. These findings suggest that optimizing machine energy use or transitioning to more energy-efficient systems could drastically reduce environmental burdens.
The Machine Annual Cycle (+10%) parameter also demonstrated notable effects on environmental indicators. Increasing the machine cycle load by 10% resulted in a \(-2.86\%\) reduction in Carbon Footprint and a \(-3.27\%\) decrease in Remaining Human Health Damage. These results highlight the importance of optimizing machine operation cycles to improve resource and energy efficiency. While the magnitude of change was lower compared to MFF, the impact remains significant and actionable. This parameter indicates the sensitivity of environmental results to machine use frequency and highlights it as a key operational lever for improvement.
In contrast, the Mass Body Corning (+10%) parameter displayed a smaller but positive influence on environmental indicators, increasing the Carbon Footprint by \(+2.19\%\) and Fossil and Nuclear Energy Use by \(+1.14\%\). The positive change suggests that heavier materials and mass components contribute directly to higher energy demands, particularly in production and transport phases. While the influence of this parameter is less significant than energy-related ones, it emphasizes the role of material efficiency and weight reduction as a secondary strategy for improving environmental performance.
Summary
Overall, the sensitivity analysis revealed that energy-related parameters such as MFF and Machine Annual Cycle are the dominant drivers of environmental impacts in the use phase. These parameters significantly affect indicators such as Water Scarcity Footprint, Fossil and Nuclear Energy Use, and Carbon Footprint. Addressing these energy-related parameters, for instance, through process optimization, energy-efficient equipment, or renewable energy sources, presents the greatest opportunity for reducing environmental burdens. Meanwhile, material mass, although less impactful, still warrants attention, particularly for reducing production and transportation-related impacts.
In summary, this sensitivity analysis highlights the following key findings:
Energy Consumption (MFF +10%): The most critical driver, particularly for Water Scarcity and Fossil Energy Use.
Machine Operations (Machine Annual Cycle +10%): Substantial influence on Carbon Footprint and Human Health Damage.
Material Efficiency (Mass Body Corning +10%): Plays a secondary role but remains relevant for improving environmental performance.
Additional sensitivity results for other parameters, such as transport distances and waste processes, are included in Appendix. These analyses further support the conclusion that energy optimization is the most effective lever for enhancing sustainability outcomes during the use phase of Corning Flask 431144.
Scenario Analyses - PV vs Baseline Scenario
With increasing emphasis on global sustainability goals, laboratories are under growing scrutiny for their environmental performance, particularly regarding energy use. Solar photovoltaic (PV) energy has emerged as a key solution for laboratory sustainability as it provides a low-carbon, renewable alternative to conventional electricity. By integrating PV energy, laboratories can significantly reduce their environmental burden during operations. This study compares a PV scenario with a baseline scenario to assess potential improvements.
PV electricity generates significantly lower carbon emissions during production compared to traditional grid electricity, particularly in regions reliant on fossil fuels. Replacing grid electricity during cleaning and sterilization processes can effectively reduce the system’s carbon footprint. Fossil and nuclear energy consumption, which are major contributors to environmental impacts in the baseline scenario, are also significantly reduced by introducing PV energy. Additionally, PV energy has lower water consumption compared to grid electricity, which relies heavily on water for cooling during power generation. Given that EPFL already operates its own PV power system, the adoption of solar energy is technically feasible and aligns with EPFL’s long-term campus sustainability goals.
Scenario Setup
In the baseline scenario, electricity for the cleaning and sterilization stages is sourced from the market grid electricity, represented by the flow “market for electricity, low voltage.” In the PV scenario, the electricity source is replaced by PV power, using the flow *“electricity production, photovoltaic, 3kWp slanted-roof installation, ribbon-Si, panel, mounted.”
To evaluate the environmental impacts of these scenarios, we applied the IMPACT World+ method within the life cycle assessment framework. This method provides a comprehensive evaluation across multiple impact categories, including climate change, fossil and nuclear energy use, ecosystem quality, human health damage, and water scarcity. The analysis specifically focuses on the Corning 431144 Erlenmeyer flask during the cleaning and sterilization stages. This flask serves as the functional unit (FU) for comparing environmental impacts between the baseline and PV scenarios.
Results Analysis

The carbon footprint in the baseline scenario is 27.00 kg CO2-eq, while in the PV scenario, it is reduced to 23.84 kg CO2-eq, a decrease of approximately 12%. The life-cycle carbon emissions of PV electricity are significantly lower than conventional grid electricity.
Fossil and nuclear energy consumption drops from 639.42 MJ deprived in the baseline scenario to 276.49 MJ deprived in the PV scenario, a reduction of 57%. The use of PV power effectively reduces dependence on non-renewable energy sources.
For ecosystem quality, the baseline scenario measures 4.18 PDF\(\cdot\)m2\(\cdot\)yr, while the PV scenario reduces this to 3.66 PDF\(\cdot\)m2\(\cdot\)yr, an approximate 13% decrease. This demonstrates that PV energy has a smaller impact on ecosystem damage compared to grid electricity.
Human health damage, expressed in DALY, increases slightly from 3.06E-05 in the baseline to 3.27E-05 in the PV scenario, an increase of approximately 7%. This small rise is likely due to the resource extraction and manufacturing processes involved in PV electricity production. However, the overall impact remains minimal and acceptable.
Water scarcity footprint is significantly improved, with the baseline scenario measuring 52.13 m3 world-eq and the PV scenario reducing this to 18.67 m3 world-eq, a 64% decrease. PV electricity requires significantly less water compared to conventional grid power, particularly in cooling processes during generation.
The PV scenario demonstrates clear environmental advantages by reducing the carbon footprint, fossil and nuclear energy consumption, and water scarcity impacts. Although human health damage increases slightly, the magnitude of change is minimal and acceptable. With EPFL’s existing PV infrastructure, the transition to PV electricity is both technically feasible and aligns with the institution’s sustainability strategy. This shift can significantly contribute to reducing the environmental burden of laboratory operations.
Uncertainties and limits of the study
Uncertainties and limitations
Limitation of Functional Unit Definition
The functional unit in this study is defined as the “number of flasks required to process 25 L of cell culture medium.” While this definition is practical for comparing flask systems, it introduces potential limitations. For instance, equating a 2.5 L flask to 10×250 mL flasks may hold true in industrial contexts due to scalability, but such assumptions may not reflect operational realities in research laboratories. Consequently, this functional unit might overestimate the environmental advantages of larger flasks, as their benefits are dependent on specific usage patterns. This limitation should be carefully documented to avoid overgeneralization.
Uncertainty in Flask Production and Transportation
The environmental impact of flask production and transportation stages is influenced by both known and uncertain factors:
Flask production: While parameters like volume, material, fabrication site, and initial sterilization are well-defined, uncertainties remain regarding the production of raw materials, fabrication processes, and initial sterilization impacts.
Transportation: Known aspects include approximate distances traveled, but uncertainties arise from shipping modes (e.g., air, train, or cargo vessels) and packaging materials used, both of which affect environmental outcomes.
Uncertainty in Cleaning and Sterilization
This study reveals that multi-use flasks generally outperform single-use flasks in terms of environmental impact. However, this advantage is contingent upon the efficiency of cleaning and sterilization processes, represented by the Maximum Flask Factor (MFF), which measures equipment loading efficiency:
Low MFF: Underloaded sterilization cycles increase per-flask energy and water consumption, reducing environmental efficiency;
High MFF: Fully loaded sterilization cycles maximize resource efficiency, making multi-use flasks more sustainable.
Additionally, the environmental impacts of equipment maintenance and detergent use are excluded from the analysis, which could understate the resource demands of cleaning processes, although the impact is considered relatively small with respect to water and electricity use in each washing cycle. This exclusion should be addressed in future iterations for a more comprehensive evaluation.
Data quality
An assessment of data quality reveals key insights into the reliability and representativeness of lifecycle stages for single-use and multiple-use flasks, the results are summarized in Figure 15 and Figure 16.


The evaluation underlines the significance of improving the data quality of flask production process for single use flasks as well as the cleaning process for multiple use flasks.
Recommendations
Based on the findings of this Life Cycle Assessment, the following recommendations are made regarding the use of flasks:
Transition to Multiple-Use Flasks where Feasible
The findings of the LCA strongly support the adoption of multiple-use flasks as the default option for most laboratory applications within SV-PTPSP and similar labs. This conclusion is based on their consistently lower environmental impacts compared to single-use flasks in key categories, including:
Carbon Footprint: Across types, multi-use flasks reduce emissions by about 50-60% on average, which is especially impactful for smaller flask types (Corning 431144 for example)
Fossil Energy Use: Multi-use flasks have consistently lower energy consumption relative to the functional unit when compared to their single-use counterpart.
Ecosystem Quality: Lower impacts are observed due to reduced material extraction and waste generation, as well as reduced transport impact.
Key Actions for a Successful Implementation
Maximize Flask Lifespan: To fully realize the environmental benefits, reusable flasks must be utilized to their maximum designed reuse cycles. Proper handling and maintenance protocols should be implemented to prevent premature wear and contamination risks.
Optimize Washing and Autoclaving Processes: Because Water Scarcity impact is the main drawback for multi-use flasks, the impact should be properly addressed by increasing the machine fill factor to minimize per-flask water and energy use. Additionally, though it is not within the scope of the study, investigating and adopting water reuse systems could help address water scarcity impacts.
Selective Use of Single-Use Flasks: Reserve single-use flasks for specialized applications. In such cases, choose materials with lower overall impacts, such as polypropylene.
Monitor and Review Performance: Conduct periodic evaluations of flask reusability, water use efficiency, and overall environmental impact to ensure the lab meets the desired sustainability objectives.
Conclusion
This LCA has comprehensively evaluated the environmental impacts of single-use and multiple-use flasks used in laboratory operations at the SV-PTPSP lab, providing actionable insights into the trade-offs between these two systems. The study conclusively shows that transitioning to reusable flasks offers substantial benefits, including:
An average 50% reduction of carbon footprint.
A significant reduction of energy use, especially for locally sourced polypropylene flasks (close to 50% reduction).
Lower impacts on ecosystem quality through reduced material extraction and waste generation.
However, the environmental benefits of reusable flasks are tempered by increased water use during cleaning and autoclaving processes. These drawbacks can be mitigated through operational optimizations such as improving machine fill factors, enhancing water efficiency, and integrating renewable energy sources like photovoltaics.
In conclusion, adopting reusable flasks, combined with targeted process optimizations, represents a viable pathway to enhancing sustainability in laboratory operations. These insights provide a valuable foundation for EPFL and similar research platforms to make informed decisions that align with global sustainability goals.
References
Citation
@online{tschammer-osten2024,
  author = {Tschammer-Osten, Aiden and Rigamonti, Alberto and
    Bernharðsson, Eiríkur and Nassar, Mariam and Yang, Shiqi and Liu,
    Wenyu},
  title = {Assessing the Impact of Autoclaving Versus Purchasing New
    {Plastic} {Flasks} in a Technological Platform},
  date = {2024-12-22},
  url = {https://wenyuliu.ch/blog/2024/12/Assessing-the-impact-of-autoclaving-versus-purchasing-new-plastic-flasks/},
  langid = {en}
}